> ## Documentation Index
> Fetch the complete documentation index at: https://docs.depost.ai/llms.txt
> Use this file to discover all available pages before exploring further.
# Create an infographic
> Ask for a visual in chat, or turn something you've already written into one.
Infographics are made in chat, not in a separate tool. The **Create infographic** button on
the Infographics screen simply takes you to a new chat — there's no other editor behind it.
## It always starts from something
An infographic is built from material that already exists in the thread — a draft, an idea,
or a post. Asking cold won't work:
> *"Make an infographic comparing manual posting to a content system"*
> → *"I need something to create infographic prompt from, and there is nothing in this
> thread yet to use."*
So give it something first.
The usual route. Write the post, then convert it:
1. *"Write a short post contrasting manual posting with a content system"*
2. *"Now turn that post into an infographic"*
On a draft in chat you can also use **Create infographic from this post**, which does
the same thing in one click.
Ask for infographic ideas first, then pick one:
* *"What could I turn into an infographic this week?"*
* *"Turn the second one into an infographic"*
Point at something you've already published:
* *"Turn my last post about pricing into an infographic"*
## What happens next
Depost AI builds the *content* first — the thesis, the blocks, the labels — then renders the
image from it.
That order matters, because it's your chance to intervene. If the wording is wrong, say so
before asking for the image. Fixing text after the render means generating again.
You get the structure and copy back first — a title, the blocks, the labels. No image
yet.
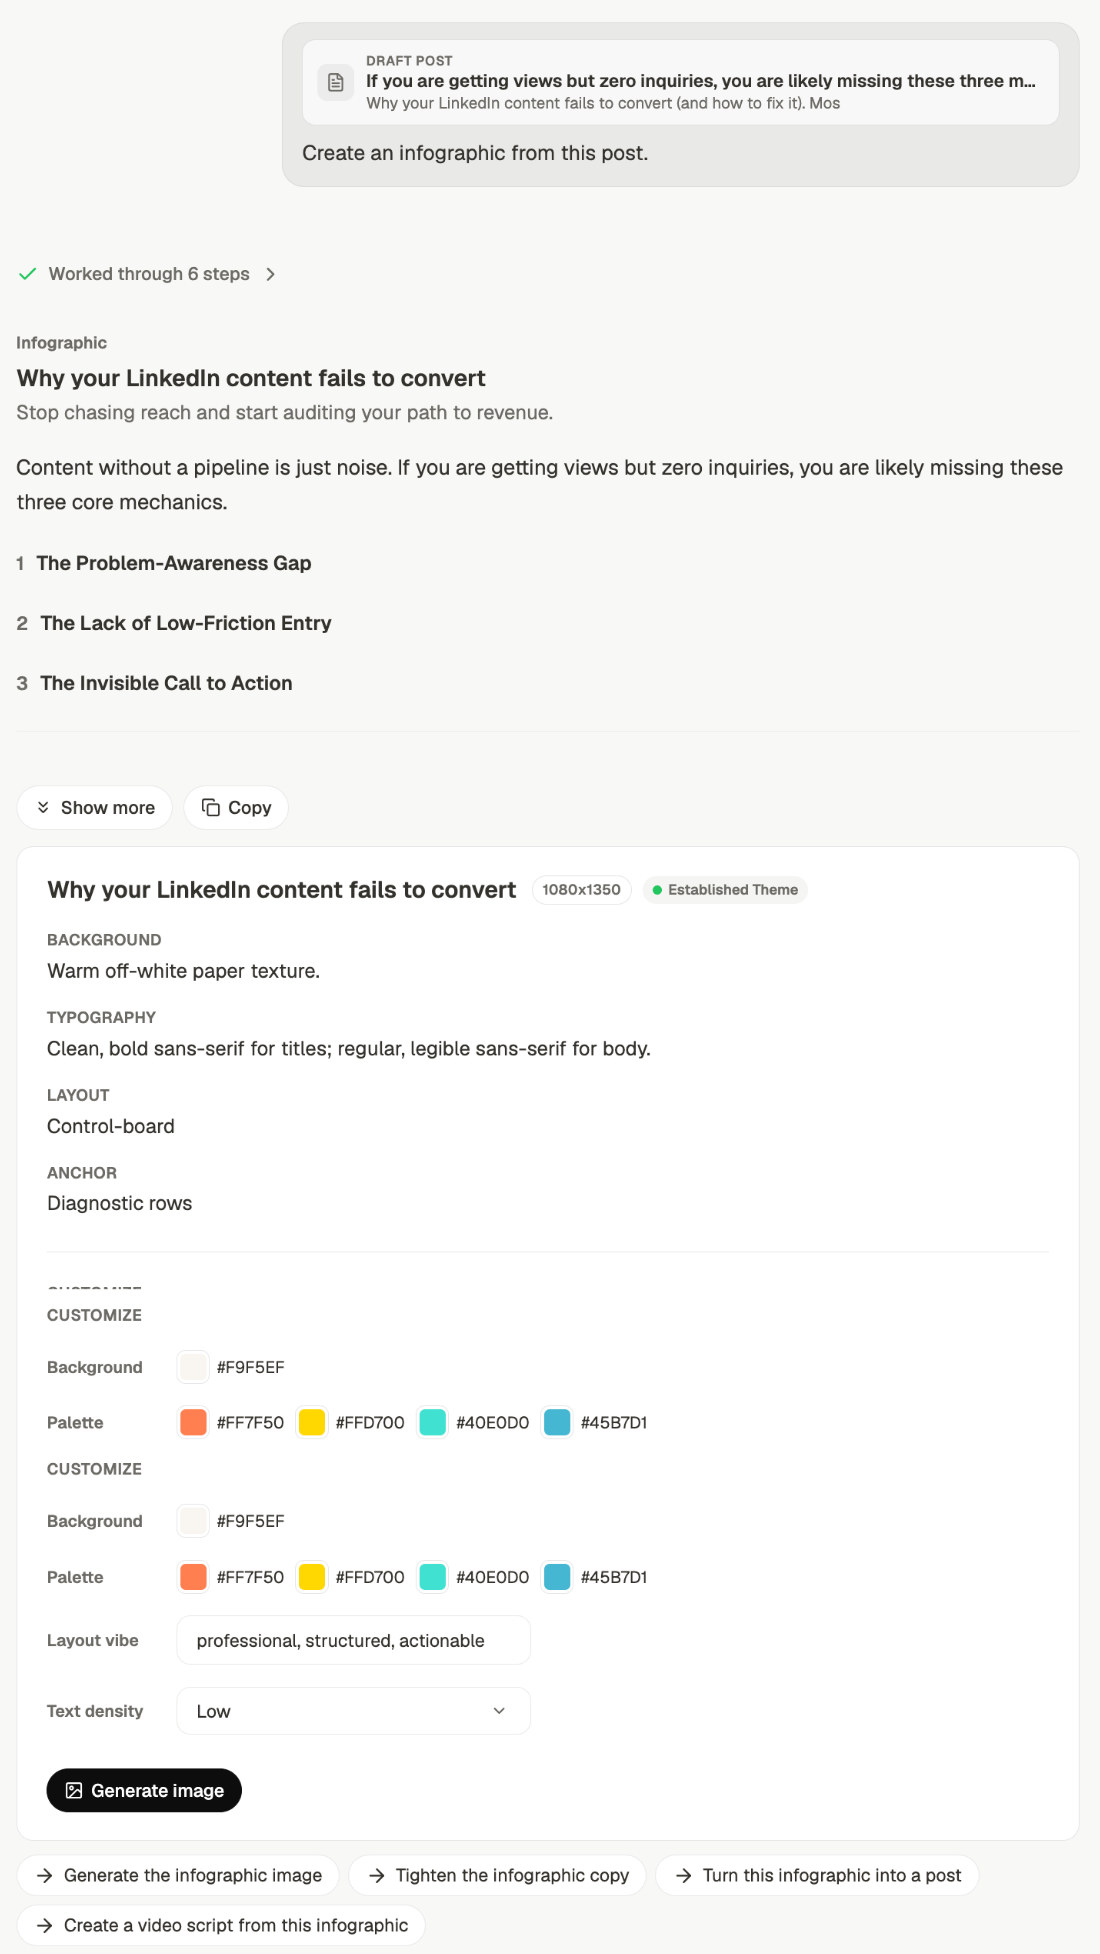 Underneath sits a card describing how it will be **drawn** — the size, the background,
the typography, the layout, and whether your saved theme is being used.
**Customize** is where you change any of that before anything is rendered: the
background color, the palette, the **layout vibe** in your own words, and the **text
density**. Then **Generate image**.
Text density is the one worth touching. **Low** is usually right — an infographic is
read at a glance in a feed, not studied.
*"Change the middle section to talk about distribution, not creation."* Cheap now,
expensive later.
*"Generate the infographic image"*. It renders in your visual style and lands in your
gallery.
Underneath sits a card describing how it will be **drawn** — the size, the background,
the typography, the layout, and whether your saved theme is being used.
**Customize** is where you change any of that before anything is rendered: the
background color, the palette, the **layout vibe** in your own words, and the **text
density**. Then **Generate image**.
Text density is the one worth touching. **Low** is usually right — an infographic is
read at a glance in a feed, not studied.
*"Change the middle section to talk about distribution, not creation."* Cheap now,
expensive later.
*"Generate the infographic image"*. It renders in your visual style and lands in your
gallery.
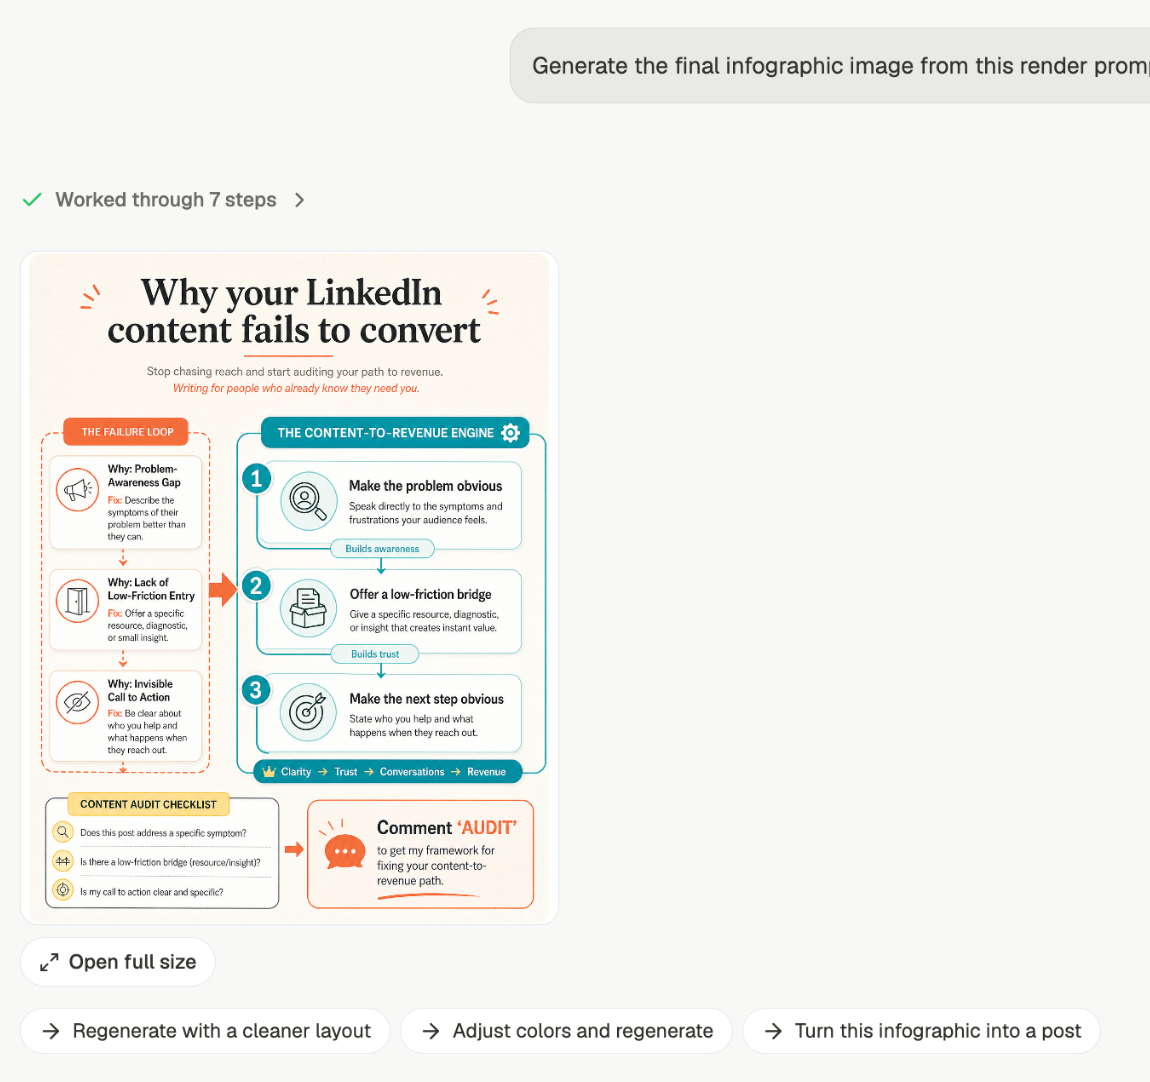 Under the image: **Open full size**, **Regenerate with a cleaner layout**, **Adjust colors
and regenerate**, and **Turn this infographic into a post**. Use the regenerate actions
rather than starting over — they keep the content and change only the rendering.
## It lands on the post
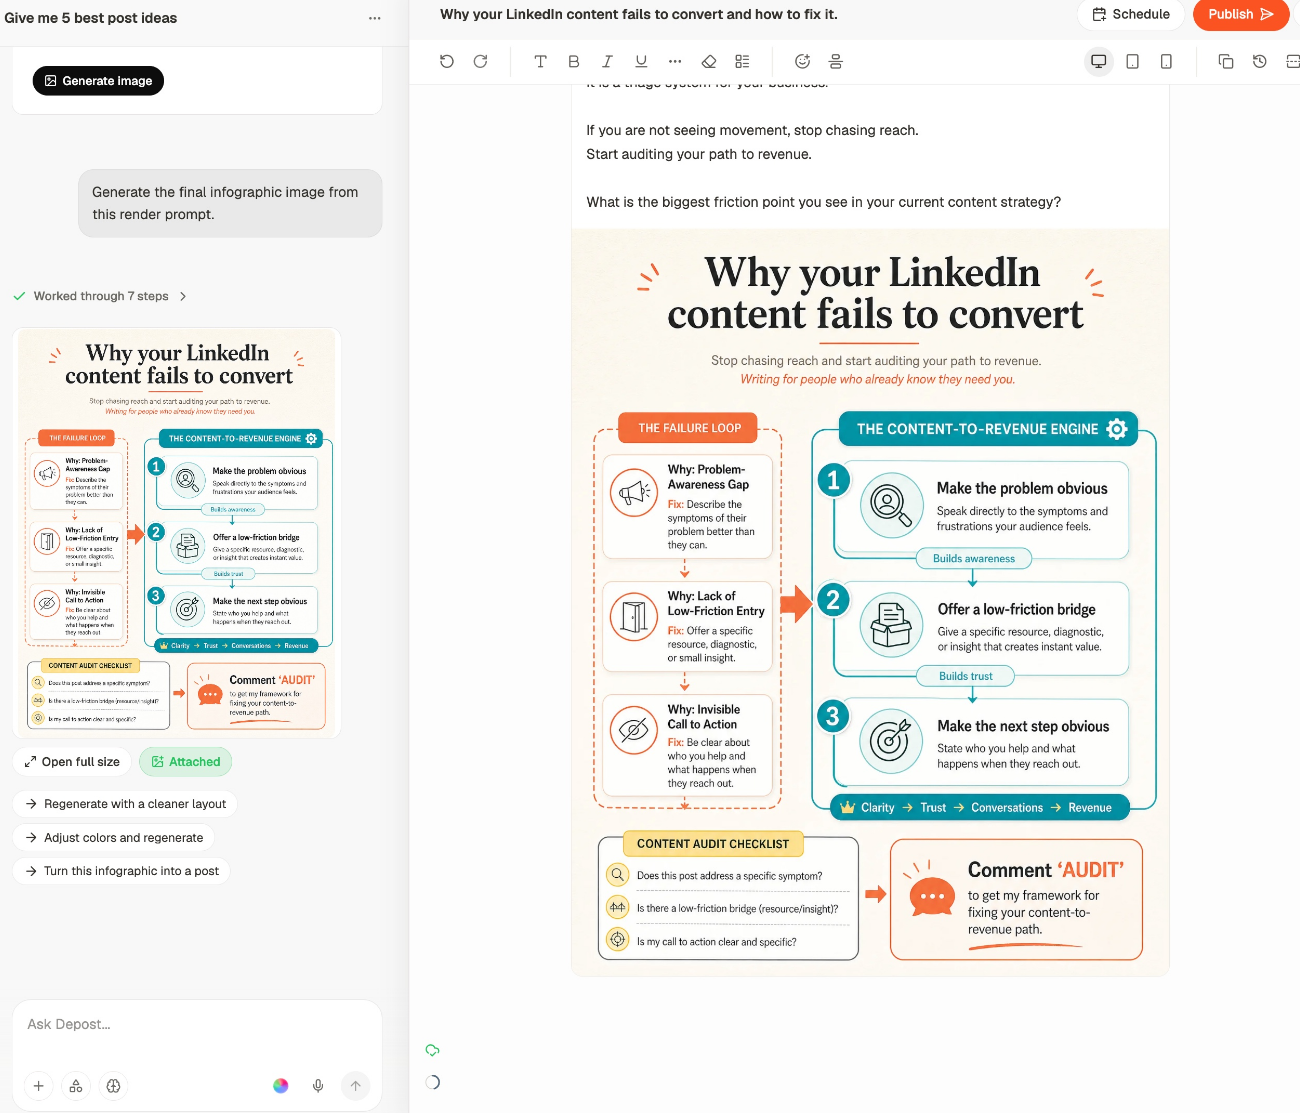
If the infographic came from a draft, it attaches to that post rather than sitting in the
thread on its own. The chat panel marks it **Attached**, and it's there in the editor next
to the text, ready to publish together.
Under the image: **Open full size**, **Regenerate with a cleaner layout**, **Adjust colors
and regenerate**, and **Turn this infographic into a post**. Use the regenerate actions
rather than starting over — they keep the content and change only the rendering.
## It lands on the post
If the infographic came from a draft, it attaches to that post rather than sitting in the
thread on its own. The chat panel marks it **Attached**, and it's there in the editor next
to the text, ready to publish together.
 ## Getting a better one
Infographics work when there's a structure to show — stages, a comparison, a framework,
a before and after. A list of tips is a post, not a visual.
The point is to be readable at a glance in a feed. If it needs reading, write a post.
Without a visual style, output won't look like your brand. See
[your visual style](/visuals/style).
## Related
Make generated visuals look like yours.
Everything you've generated.
Other formats from the same material.
Getting a visual into a post.
## Getting a better one
Infographics work when there's a structure to show — stages, a comparison, a framework,
a before and after. A list of tips is a post, not a visual.
The point is to be readable at a glance in a feed. If it needs reading, write a post.
Without a visual style, output won't look like your brand. See
[your visual style](/visuals/style).
## Related
Make generated visuals look like yours.
Everything you've generated.
Other formats from the same material.
Getting a visual into a post.